
Introduction
While previous chapters explained the theoretical foundations of exchange rate determination and the structure of exchange rate systems, the real world often defies clean models. Currency values are shaped not only by interest rates, inflation, and market sentiment—but also by political decisions, speculative behaviors, and broader economic cycles.
This appendix explores the dynamic and often unpredictable nature of global finance through five interconnected topics:
- the political-economic turning point of the Plaza Accord,
- the far-reaching capital flows triggered by yen carry trades,
- the controversial practice of short selling,
- the recurring phases of the business cycle, and
- the dominant role of the U.S. dollar as the world’s most powerful export.
Together, these topics provide a practical lens for understanding how global currency systems truly operate in volatile and interconnected environments—moving beyond theory into the realm of lived financial history and strategic behavior.
Appendix I: The Plaza Accord and Its Devastating Impact on the Japanese Economy
1. Background of the Plaza Accord
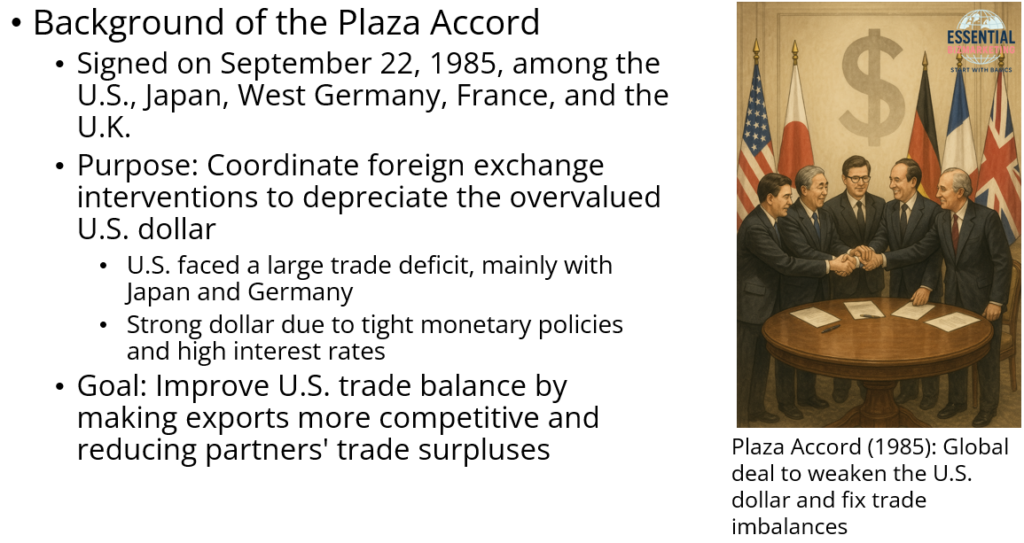
The Plaza Accord, signed on September 22, 1985, was an agreement among five major economies—the United States, Japan, West Germany, France, and the United Kingdom—to coordinate foreign exchange interventions to depreciate the overvalued U.S. dollar. At the time, the United States was facing a massive trade deficit, primarily with Japan and Germany, while the U.S. dollar remained strong due to tight monetary policies and high interest rates. The goal of the agreement was to improve the U.S. trade balance by making American exports more competitive and reducing the trade surpluses of its partners.
2. The Five Stages of Japan’s Economic Decline After the Plaza Accord
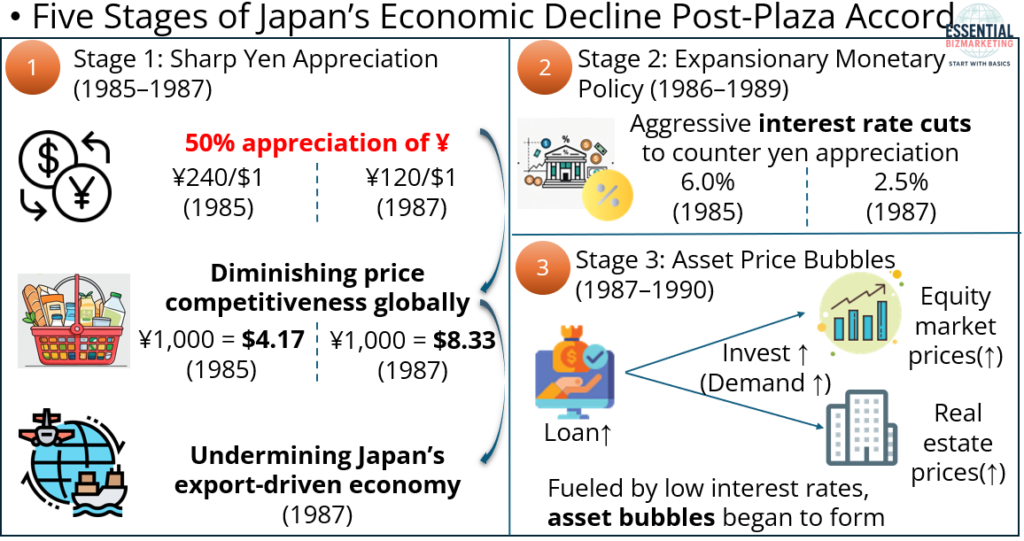
Stage 1: Sharp Yen Appreciation (1985-1987)
The yen appreciated by nearly 50%, from 240 yen per dollar in 1985 to 120 yen per dollar in 1987. This sharp rise diminished the price competitiveness of Japanese exports globally, making them more expensive in international markets. As a result, Japan’s export-driven economy faced significant challenges.
Stage 2: Expansionary Monetary Policy (1985-1989)
To address the negative effects of the yen’s appreciation, the Bank of Japan adopted an aggressive monetary easing policy, cutting interest rates significantly, down to 2.5% by 1987. This policy injected liquidity into the economy, particularly flowing into asset markets like real estate and equities. As a result, demand for these assets surged, leading to the formation of asset bubbles.
Stage 3: Asset Price Bubbles (1987-1990)
Fueled by low interest rates and speculative behavior, asset bubbles began to form. Investors poured money into real estate and equity markets, driving up asset prices. The Nikkei 225 stock index tripled, reaching nearly 39,000 points, and land prices in Tokyo skyrocketed, with central Tokyo real estate being valued higher than all of the land in the United States combined.
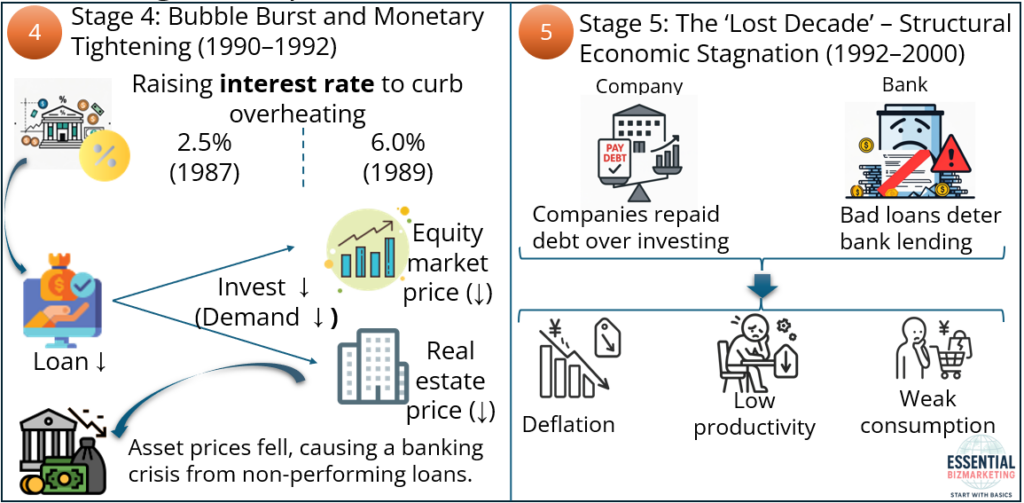
Stage 4: Bubble Burst and Monetary Tightening (1990-1992)
In an attempt to curb the overheating economy, the Bank of Japan raised interest rates in 1989. This caused the asset bubbles to collapse. Stock and land prices fell sharply, and the Nikkei index lost more than 60% of its value by 1992. A banking crisis followed as non-performing loans increased, damaging financial institutions.
Stage 5: The ‘Lost Decade’ – Structural Economic Stagnation (1992-2000)
After the collapse of the asset bubbles, Japan entered a prolonged period of economic stagnation known as the “Lost Decade.” Companies focused on repaying debt rather than investing, and banks, burdened with bad loans, became hesitant to lend. This led to deflation, low productivity growth, and weak consumer demand, resulting in a prolonged period of weak economic recovery.
3. Conclusion
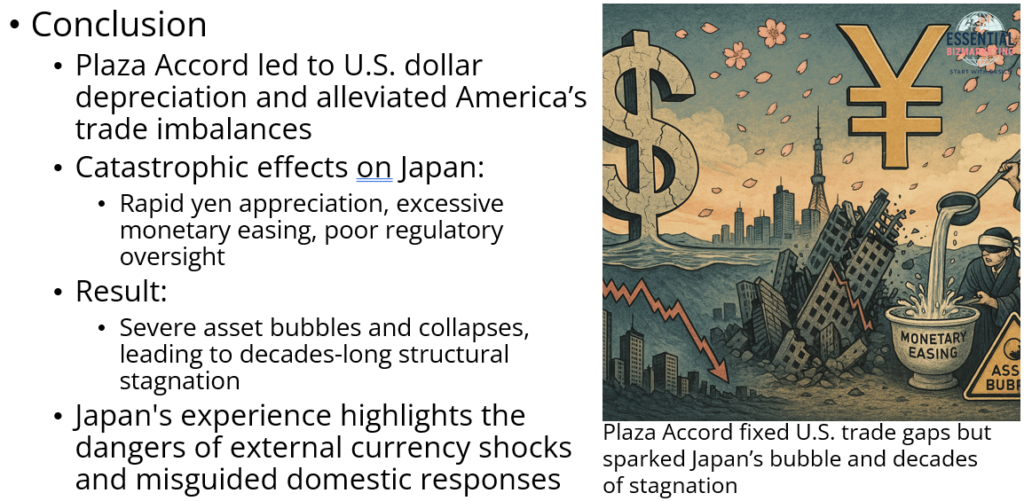
While the Plaza Accord successfully facilitated the depreciation of the U.S. dollar and partially alleviated America’s trade imbalances, its consequences for Japan were catastrophic. Rapid yen appreciation, followed by excessive monetary easing, and poor regulatory oversight, culminated in one of the most severe asset bubbles and collapses in modern economic history.
Japan’s experience serves as a cautionary tale of how external currency shocks, when coupled with misguided domestic responses, can lead to decades-long structural stagnation.
Appendix II: Yen Carry Trade
1. Introduction: What is Yen Carry Trade?
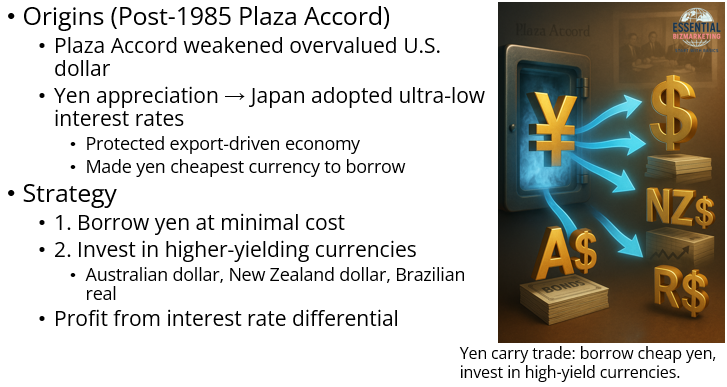
The yen carry trade emerged as a prominent global financial strategy following the 1985 Plaza Accord, which marked a coordinated effort by major economies to weaken the overvalued U.S. dollar. As a result, the Japanese yen appreciated rapidly, prompting Japan to adopt and maintain an ultra-low interest rate policy to protect its export-driven economy and stimulate domestic growth. This prolonged period of low interest rates made the yen one of the cheapest currencies to borrow.
In this environment, investors began borrowing yen at minimal cost and investing in assets denominated in higher-yielding currencies, such as the Australian dollar, New Zealand dollar, or Brazilian real. The goal was to profit from the interest rate differential between Japan and these higher-rate economies.
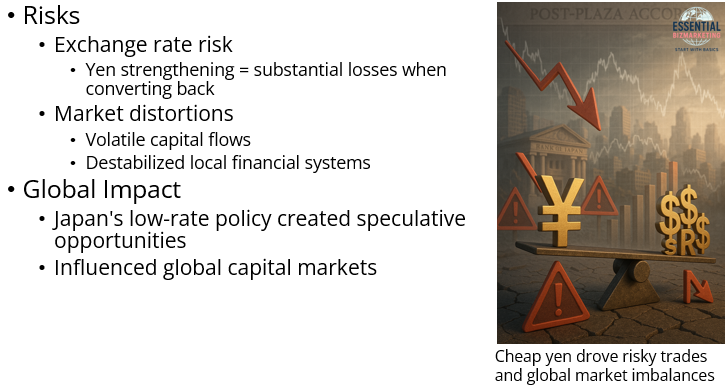
However, the strategy came with significant risks, particularly related to exchange rate fluctuations. If the yen were to strengthen during the investment period, converting the foreign returns back into yen could result in substantial losses.
Moreover, large-scale yen carry trades often led to distortions in emerging market asset prices and contributed to volatile capital flows, sometimes destabilizing local financial systems. In essence, the yen carry trade became a hallmark example of how Japan’s persistent low-interest-rate environment, rooted in post-Plaza Accord policy responses, created opportunities for speculative strategies that influenced global capital markets.
2. How it works
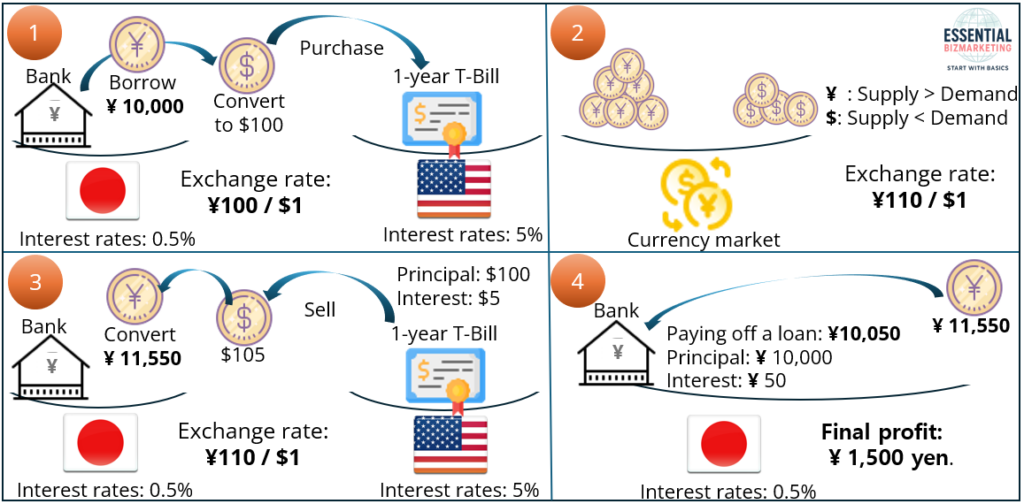
The first image illustrates the fundamental mechanics of the yen carry trade, a strategy where investors borrow yen at low-interest rates and invest in higher-yielding foreign assets, such as U.S. Treasury bonds. Initially, an investor borrows ¥10,000 from a Japanese bank at an interest rate of 0.5% and converts the yen into $100 at an exchange rate of ¥100 per dollar. The investor then purchases a one-year U.S. Treasury Bill, which offers a 5% interest rate. Over time, as a result of supply and demand dynamics in the currency market, the yen depreciates to ¥110 per dollar, making foreign investments more profitable when converted back to yen. After one year, the Treasury Bill matures, yielding a total of $105. The investor then converts this amount back to yen at the new exchange rate, receiving ¥11,550. After repaying the original loan amount of ¥10,000 plus ¥50 in interest, the final profit amounts to ¥1,500. This demonstrates that the yen carry trade is highly profitable when the yen depreciates, as it allows investors to gain more yen upon conversion after their foreign investments mature.
3. Yen Carry Trade Unwinding: Impact of Interest Rate Hikes
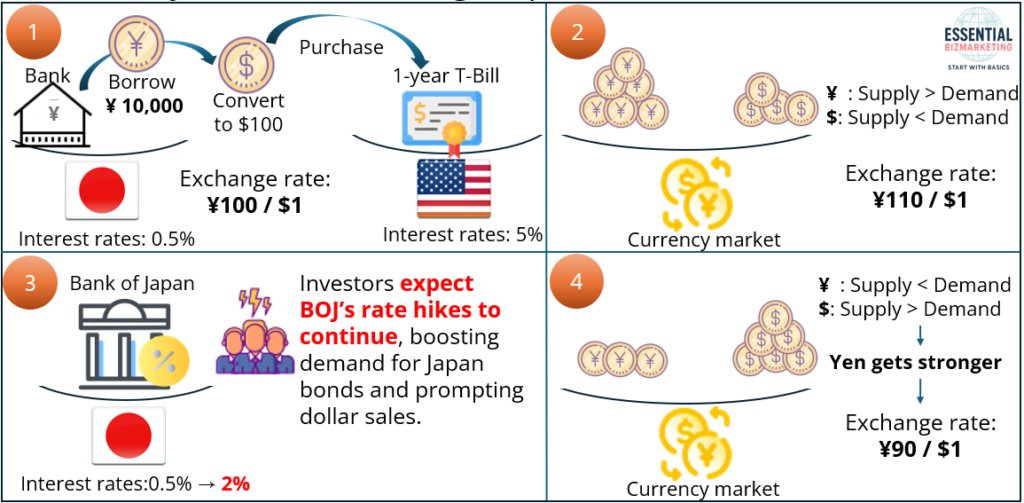
The second image explains the impact of rising interest rates in Japan, which can lead to the unwinding of yen carry trades. The initial process remains the same, with the investor borrowing ¥10,000, converting it into $100, and investing in a U.S. Treasury Bill at a 5% interest rate. As before, market dynamics initially cause the yen to weaken, shifting the exchange rate from ¥100 to ¥110 per dollar. However, the Bank of Japan then raises interest rates from 0.5% to 2%, signaling further potential hikes. This prompts investors to anticipate higher returns from Japanese bonds, increasing demand for yen while reducing demand for dollars. As a result, the exchange rate reverses course, strengthening the yen from ¥110 to ¥90 per dollar. This appreciation significantly impacts carry traders, as they now face currency exchange losses when converting their matured investments back into yen. The shift in exchange rates undermines the fundamental advantage of the carry trade, leading to capital outflows from U.S. assets and forcing investors to unwind their positions.
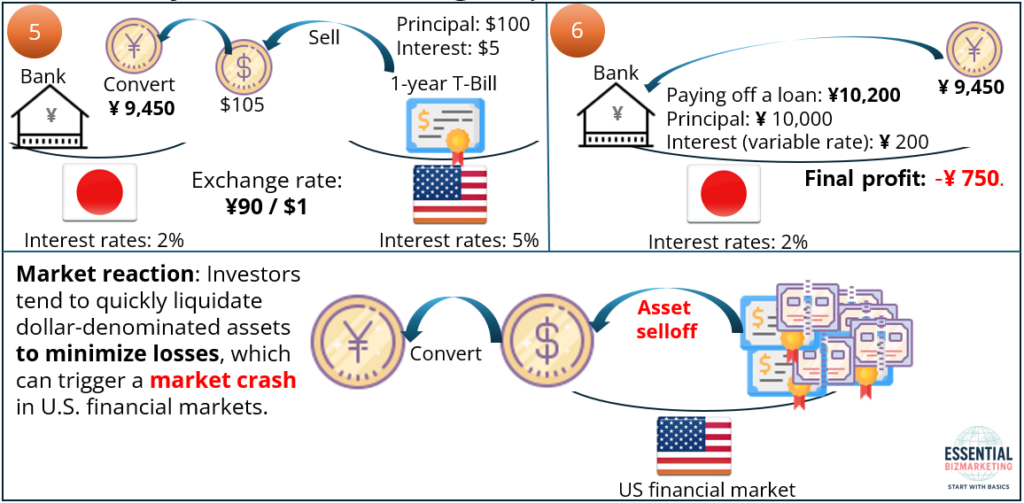
The third image depicts the final consequences of yen carry trade unwinding and its impact on financial markets. When investors sell their U.S. Treasury Bills, they receive $105, but due to the strengthened yen, they must now convert at ¥90 per dollar, leaving them with only ¥9,450. Meanwhile, their outstanding loan repayment, which includes ¥10,000 in principal and ¥200 in interest due to the Bank of Japan’s rate hikes, amounts to ¥10,200. This results in a final loss of ¥750 for the investor. As many carry traders experience similar losses, they rush to liquidate their dollar-denominated assets to minimize further damage. This large-scale selloff triggers financial instability, leading to a crash in U.S. financial markets, particularly in bonds and equities, as capital flows back into Japan. The mass liquidation of U.S. assets exacerbates market volatility, further accelerating the downturn.
The three images together illustrate how the yen carry trade, which thrives on low Japanese interest rates and a weakening yen, can become unprofitable when interest rates rise and the yen appreciates. The first image highlights the profitability of the strategy under normal conditions, where a depreciating yen enhances investment returns. The second image demonstrates how rising Japanese interest rates shift investor sentiment, increasing yen demand and causing the currency to strengthen. The third image presents the ultimate consequences, showing how a large-scale unwinding of carry trades can lead to massive selloffs in U.S. financial markets, triggering a broader market crash. In summary, while the yen carry trade offers lucrative returns under favorable conditions, it also carries the risk of significant losses and market instability when economic conditions shift.
Appendix III: George Soros & The Short Selling That Shook the British Pound
Understanding the events surrounding the 1992 British pound crisis is crucial because it highlights how financial markets, government policies, and investor sentiment interact in shaping currency stability. The episode, commonly known as Black Wednesday, serves as a key example of the risks associated with fixed exchange rate systems and the power of speculative attacks by hedge funds. The collapse of the pound also reshaped Britain’s economic policies and demonstrated the limitations of central bank interventions in defending a currency against overwhelming market forces.
1. The Beginning of the Crisis: Capital Flight and Speculation
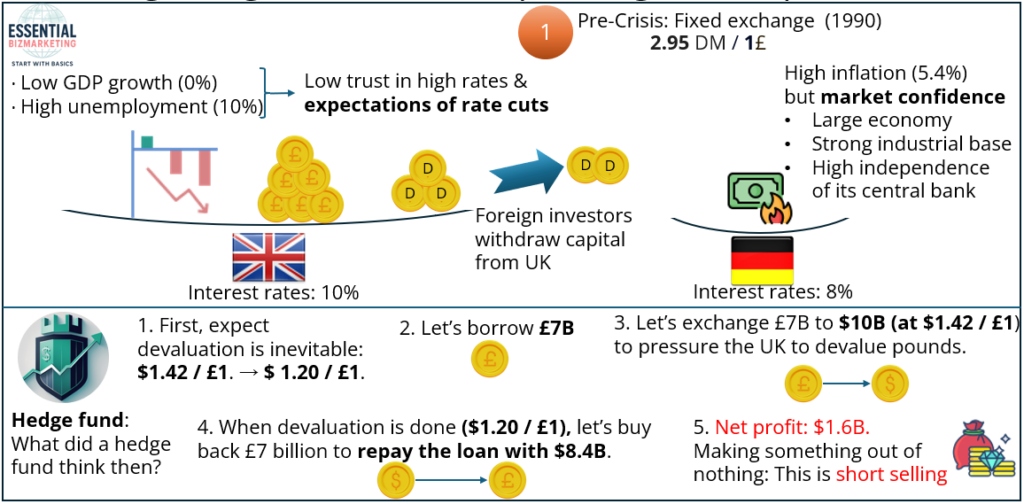
The crisis began as the British economy faced severe stagnation. GDP growth was close to zero, while the unemployment rate surged past 10%. Despite maintaining a high interest rate of 10%, the UK struggled to retain investor confidence. Many investors believed that the government could not sustain such high rates and that an interest rate cut was inevitable. This expectation, combined with capital flight, significantly weakened the pound. Meanwhile, Germany’s economy, despite facing the costs of reunification, inspired greater confidence among investors. The Bundesbank, Germany’s central bank, upheld strict monetary policies and maintained an interest rate of 8%, reinforcing trust in the Deutsche Mark (DM). This contrast between Britain and Germany further fueled speculation against the pound.
In response to these economic conditions, hedge funds led by George Soros identified an opportunity for profit by betting against the British pound. Believing that the UK government would ultimately devalue its currency, Soros and other speculators borrowed £7 billion, immediately exchanging it for $10 billion at an exchange rate of £1 = $1.42. The goal was to force the British government into a position where it could no longer defend the fixed exchange rate. If the pound were to depreciate, Soros would be able to repurchase the same amount of sterling at a lower cost, making a substantial profit.
2. The Collapse: Black Wednesday
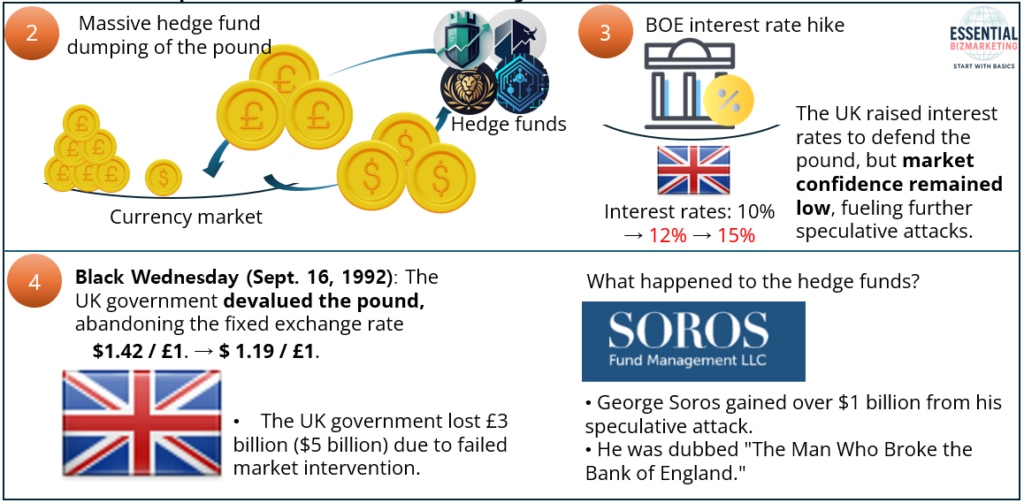
As speculation intensified, massive amounts of pounds were sold off, further pressuring the British currency. In response, the Bank of England (BOE) intervened by purchasing large amounts of pounds in the foreign exchange market. Additionally, the government raised interest rates from 10% to 12% and later announced an increase to 15% in an effort to incentivize investors to hold the pound. However, these measures failed to restore market confidence, and investors continued to sell the currency. The market perceived that the British government lacked the financial reserves and economic strength to sustain the fixed exchange rate.
On September 16, 1992—Black Wednesday— the British government was forced to abandon its defense of the pound. It withdrew from the European Exchange Rate Mechanism (ERM) and allowed the pound to float freely. As a result, the exchange rate plummeted from £1 = $1.42 to £1 = $1.19, a dramatic 15% drop in value. The UK government suffered a £3 billion loss in its failed intervention, while hedge funds, particularly George Soros’ Quantum Fund, reaped enormous profits. Soros personally made $1 billion from the short-selling strategy, earning him the title “The Man Who Broke the Bank of England.”
The British pound crisis underscored the vulnerabilities of fixed exchange rate systems when market forces and economic fundamentals are misaligned. It also demonstrated that central banks cannot indefinitely defend a currency without sufficient economic backing or credibility. In the aftermath, Britain adopted a floating exchange rate, allowing the pound to adjust based on market conditions rather than government intervention. While the devaluation initially caused turbulence, it ultimately helped the UK economy recover by making British exports more competitive.
This event remains one of the most significant cases of speculative attacks in financial history, illustrating the powerful influence of investor sentiment, central bank policy limitations, and the potential risks of rigid currency regimes.
Appendix IV: Business Cycle Phase
The economic cycle follows a repeating pattern consisting of four main phases: Expansion, Peak, Contraction (Recession), and Trough (Economic Bottoming Out). This process is influenced by both monetary policy implemented by the central bank and fiscal policy controlled by the government. Each phase has distinct economic characteristics and requires different policy measures to maintain stability and promote sustainable growth.
Understanding the economic cycle is essential for policymakers, investors, and businesses, as it helps them anticipate changes in economic conditions, adjust strategies accordingly, and make informed decisions to minimize risks and seize opportunities.
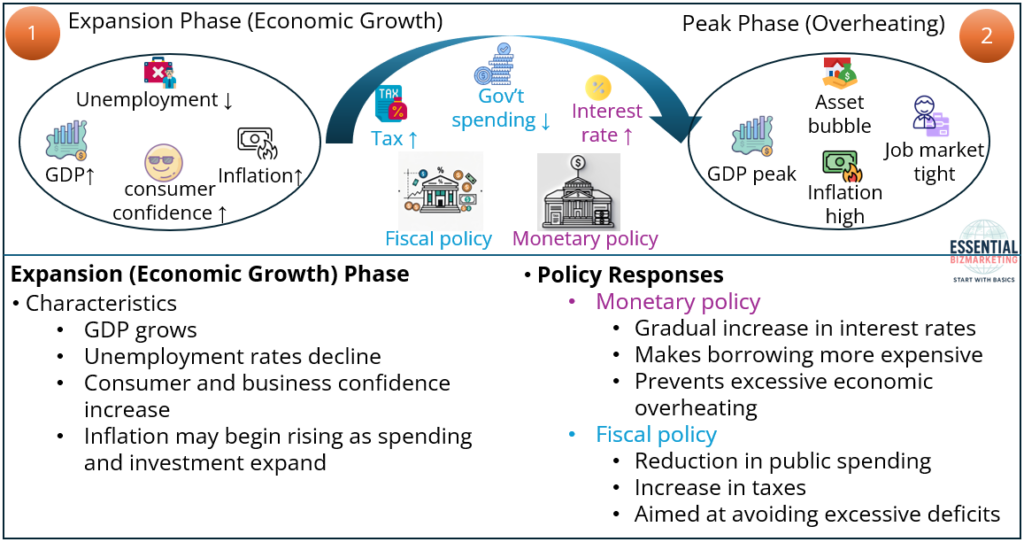
The first phase, Expansion (Economic Growth), begins when the economy starts recovering from a previous slowdown. During this phase, GDP grows, unemployment declines, and consumer and business confidence increase. However, inflation may also begin rising as spending and investment expand. To maintain economic stability, the central bank may gradually increase interest rates, making borrowing more expensive to prevent excessive overheating. The government may reduce public spending and increase taxes to avoid excessive deficits. If left unchecked, rapid growth can lead to asset bubbles and inflationary pressures.
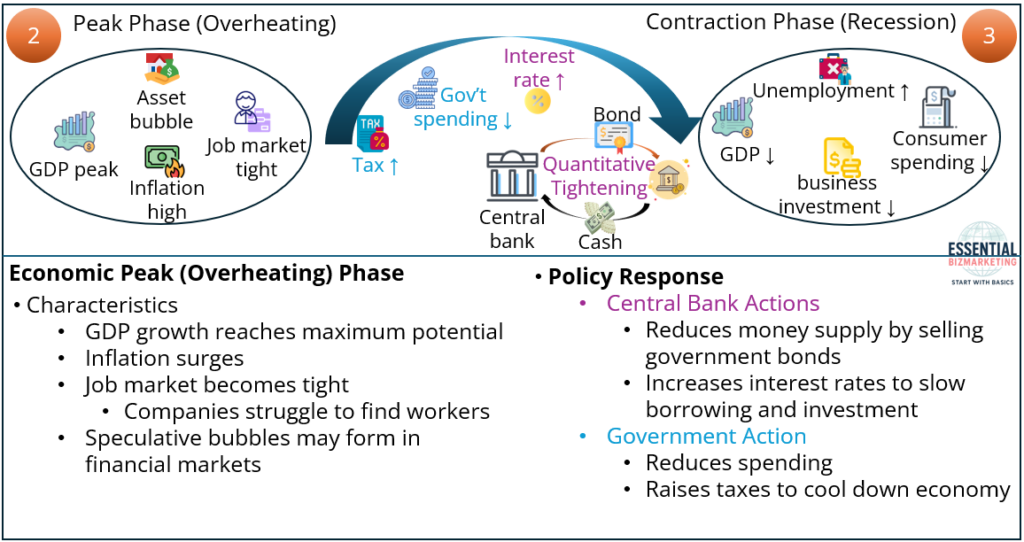
As the economy reaches the Peak (Overheating) phase, economic activity is at its highest point. GDP growth reaches its maximum potential, inflation surges, and the job market becomes tight, making it difficult for companies to find workers. Speculative bubbles may form in financial markets. In response, the central bank implements Quantitative Tightening, reducing the money supply by selling government bonds and increasing interest rates to slow down borrowing and investment. At the same time, the government reduces spending and raises taxes to cool down the economy. Despite these efforts, the economy eventually slows down due to declining consumer affordability and rising costs of borrowing.
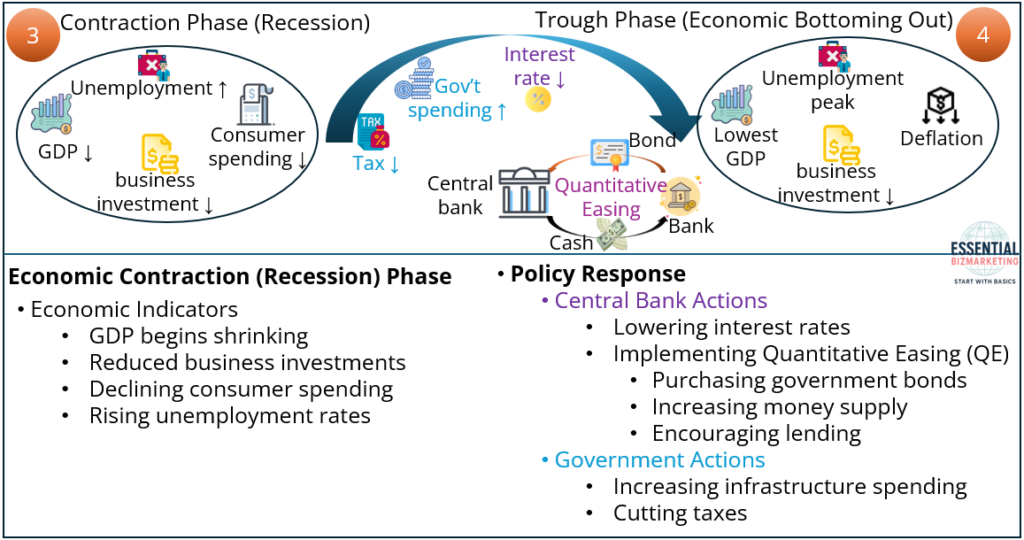
As economic conditions worsen, the economy enters the Contraction (Recession) Phase. GDP begins shrinking, businesses reduce investments, and consumer spending falls, leading to a rise in unemployment. With reduced economic activity, the central bank takes action by lowering interest rates and implementing Quantitative Easing, which involves purchasing government bonds to increase the money supply and encourage lending. The government also responds by increasing spending on infrastructure and welfare programs while cutting taxes to stimulate demand. These policies aim to reduce the severity of the recession and restore economic growth.
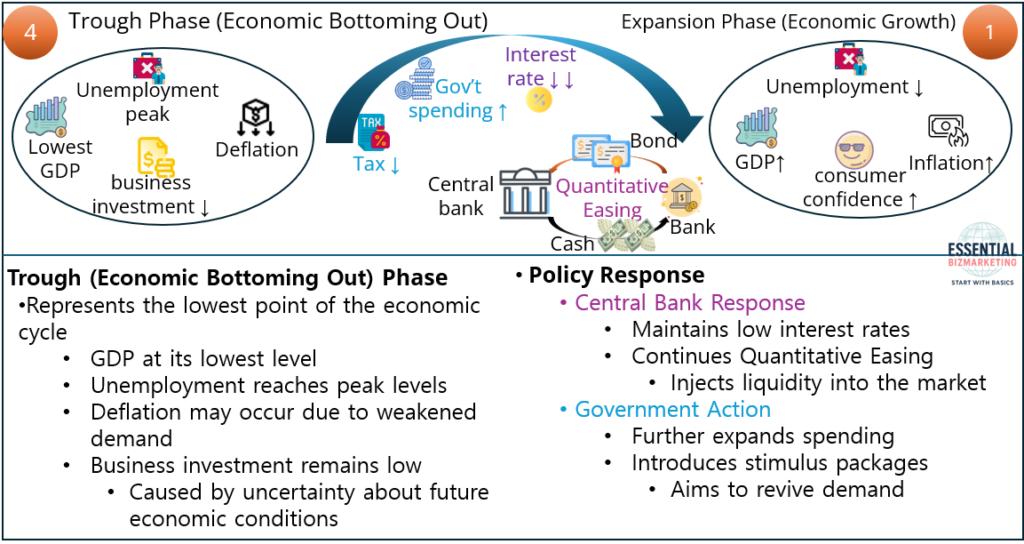
The final stage, Trough (Economic Bottoming Out), represents the lowest point of the economic cycle. At this stage, GDP is at its lowest level, unemployment reaches its peak, and deflation may occur as demand weakens. Business investment remains low due to uncertainty about future economic conditions. To counteract this, the central bank maintains low interest rates and continues Quantitative Easing to inject liquidity into the market. The government further expands spending and introduces stimulus packages to revive demand. These measures eventually restore confidence, leading the economy back into the expansion phase, repeating the cycle.
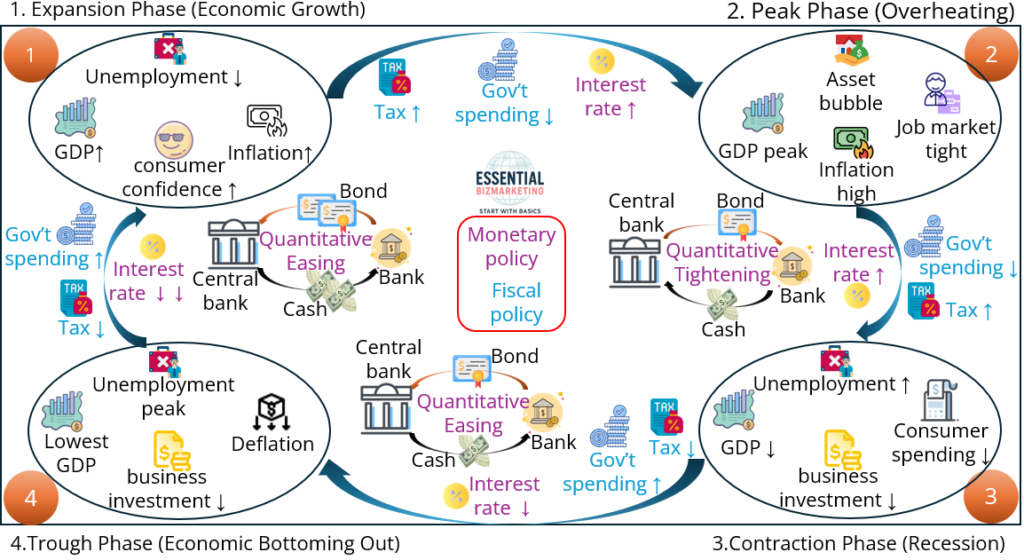
This entire process demonstrates how monetary and fiscal policies interact to influence the economic cycle. A well-coordinated approach between central banks and governments can help smooth out economic fluctuations, preventing excessive booms and deep recessions. However, policy misalignment or external shocks can disrupt this balance, leading to prolonged periods of economic instability.
Appendix V: The Ultimate US Export – The US Dollar
The U.S. dollar is more than just a national currency—it is the linchpin of the modern global economy. Since the Bretton Woods Agreement of 1944, the dollar has served as the world’s primary reserve currency, a role that continues to shape international finance, trade, and monetary policy to this day. Even after the collapse of the gold standard, key global commodities such as oil and gold have remained dollar-denominated, reinforcing the currency’s central position.
This appendix explores how the U.S. dollar circulates through the global system and examines the structural advantages it brings to the United States. By understanding this cycle—from trade and capital flows to the recycling of dollars into U.S. debt—we can better grasp the mechanisms of dollar hegemony. Equally important are the economic benefits derived from this position, such as seigniorage and financial flexibility, which grant the U.S. unique leverage in international affairs.
Understanding the global role of the dollar is essential for anyone seeking to comprehend the power dynamics of international business and finance.
1. How the U.S. Dollar Flows Through the Global Economy
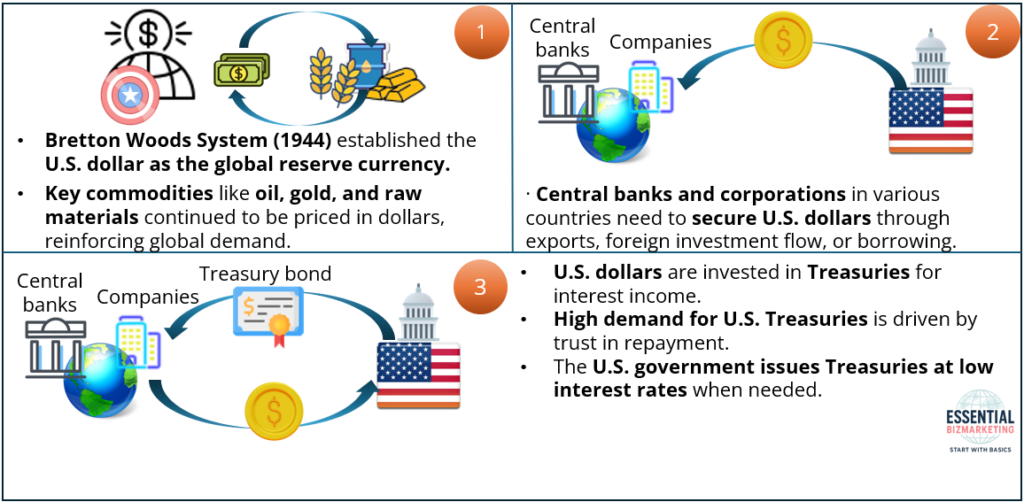
The first image explains how the U.S. dollar moves through the global economy, establishing its role as the dominant currency. The Bretton Woods System (1944) set the foundation for the dollar as the global reserve currency, and even after the gold standard ended, key commodities like oil and gold remained priced in dollars. This forced countries to hold dollars for trade and financial stability. Central banks and corporations worldwide secure dollars through exports, investments, or borrowing. These dollars are often reinvested in U.S. Treasuries, considered a safe asset. The strong demand for Treasuries allows the U.S. government to issue debt at low interest rates, ensuring continuous funding. This cycle reinforces dollar dominance, making it the ultimate U.S. export.
2. The Economic Benefits of Dollar Hegemony
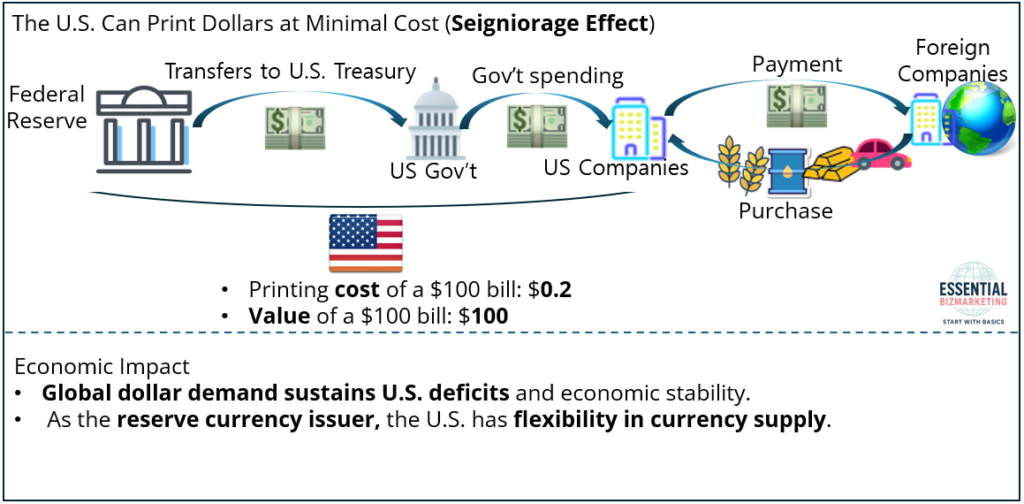
The second image illustrates the economic benefits of dollar hegemony, particularly through seigniorage. The Federal Reserve prints dollars at minimal cost, yet their market value remains significantly higher. Newly created dollars are transferred to the U.S. Treasury, which spends them on government expenditures. These dollars circulate in the economy and flow abroad through international payments. Because global demand for dollars remains high, the U.S. can sustain deficits with fewer financial constraints. As the world’s reserve currency, the dollar gives the U.S. greater flexibility in money supply without immediate risk of devaluation. This privilege helps the U.S. maintain economic stability, finance debt cheaply, and exert financial influence worldwide.
Conclusion
The topics covered in this appendix reveal that global financial systems are not governed solely by textbook mechanics.
- The Plaza Accord demonstrated how coordinated intervention could redirect economic trajectories.
- Yen carry trades showed how ultra-low interest rates can spill across borders, reshaping global investment flows.
- Short selling exposed the market’s reliance on confidence, information asymmetry, and speculative forces.
- The business cycle reminded us that no policy or trend is permanent, only cyclical.
- And the enduring dominance of the U.S. dollar highlighted how currency power can serve as a geopolitical asset.
By examining these cases, readers gain a deeper appreciation for the fluid relationship between policy, markets, and currency.
This appendix serves as a critical extension of earlier chapters—bridging theory and practice—so that business leaders, investors, and policymakers can more effectively navigate the uncertain terrain of global exchange.
📁 Start exploring the Blog
📘 Or learn more About this site
🧵 Or follow along on X (Twitter)
🔎 Looking for sharp perspectives on global trade and markets?
I recommend @GONOGO_Korea as a resource I trust and regularly learn from.